Load test summary: so-gasing.id /play/
The short version
The page itself held up well. The HTML page, /version.json and the kabupaten list stayed fast and almost never failed during the whole hour.
The leaderboard API did not. About half of all leaderboard requests failed, and for roughly 13 minutes it was completely down. Because the leaderboard is part of every page load, more than half of all simulated visits ended with a broken leaderboard.
It was already failing in the first minute, when only 3 to 8 visitors were active. So this is not only a "too much traffic" problem. The endpoint is slow even under light load and gets worse from there.
How the test was set up
| Setting | Value |
|---|---|
| Test started | 15 October 2026, 14:45:45 WIB (Asia/Jakarta, UTC+7) |
| Test ended | 15 October 2026, 15:46:45 WIB (Asia/Jakarta, UTC+7) |
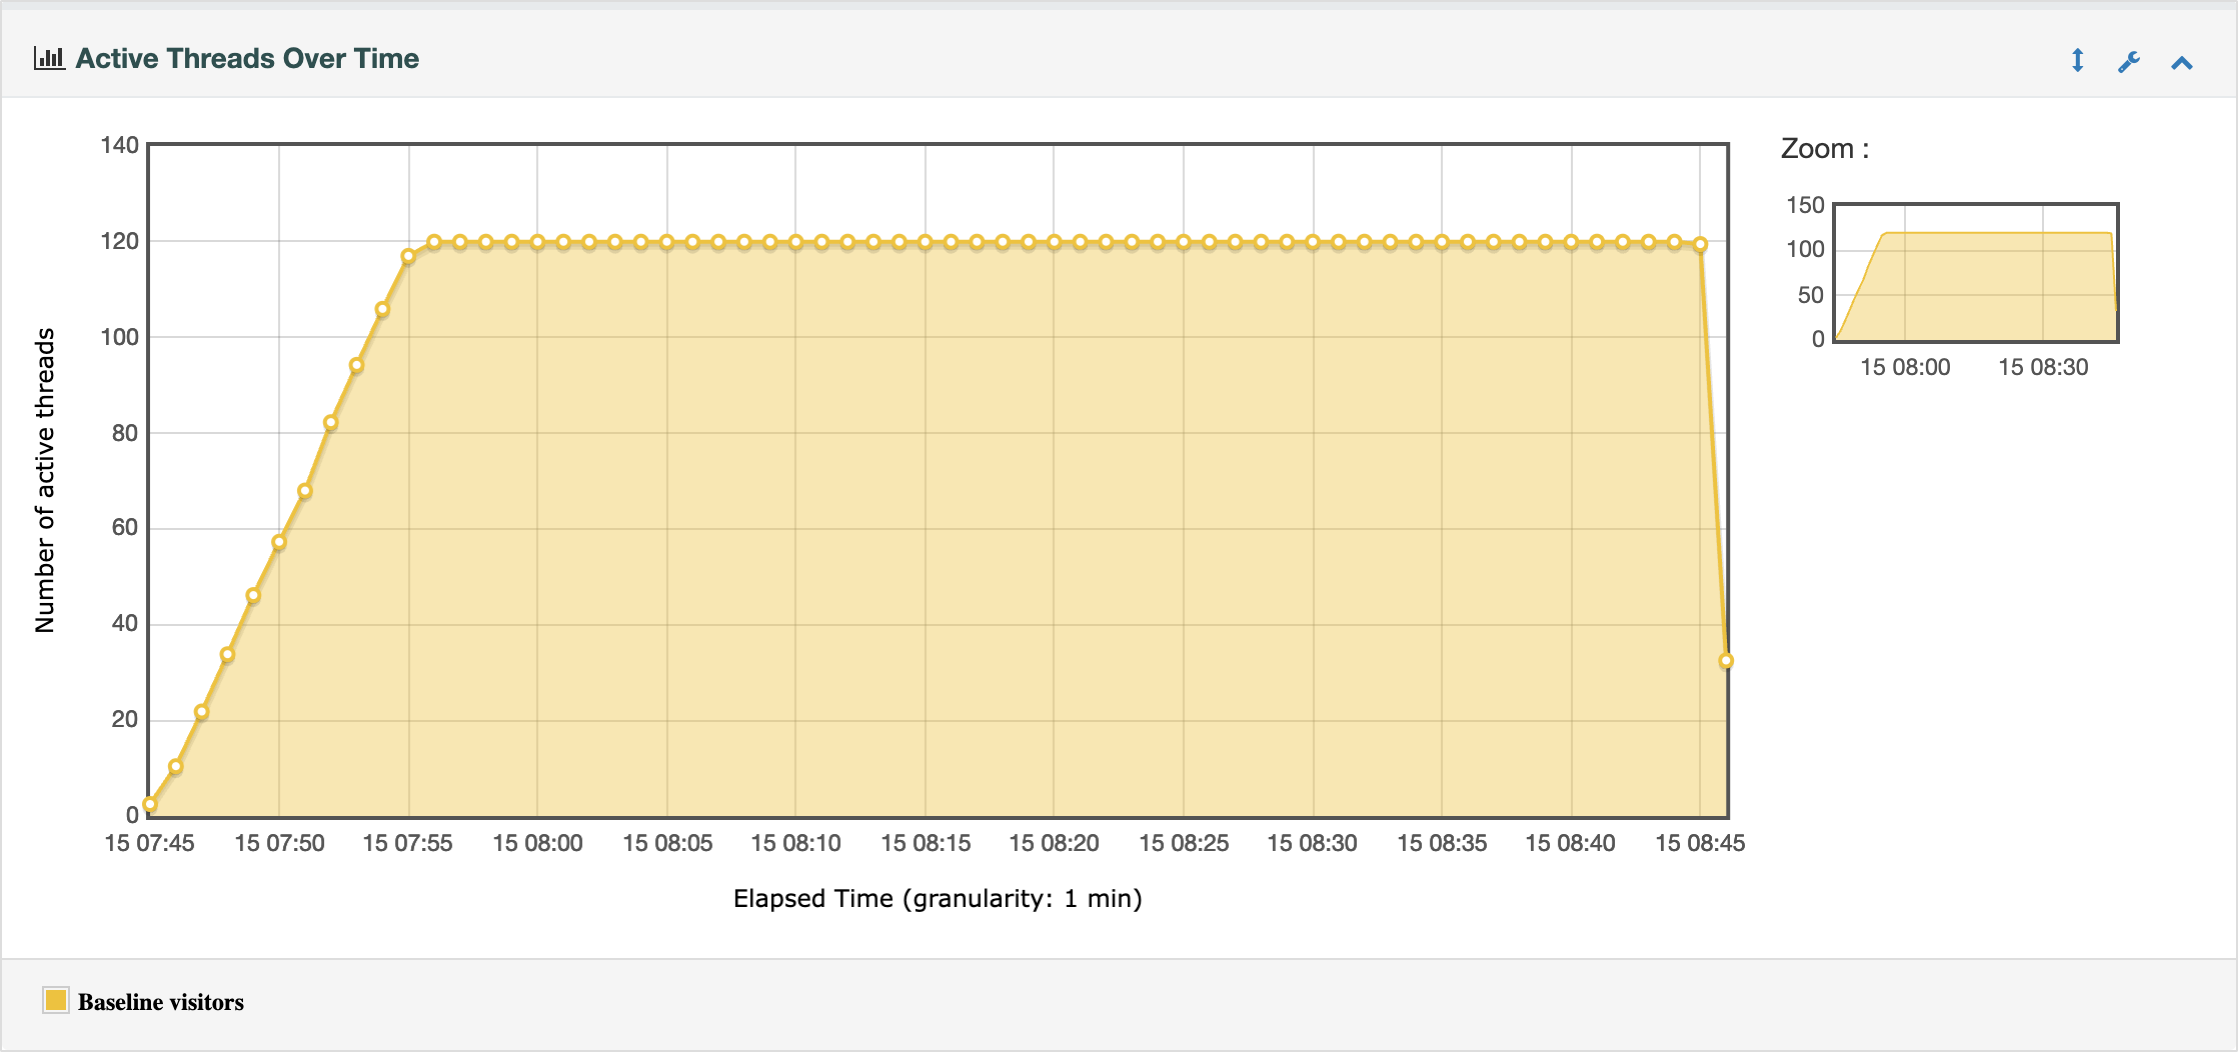
| Virtual visitors (threads) | 120 |
| Ramp up | 10 minutes (0 to 120 visitors) |
| Total length | 1 hour |
| Pause between visits | 2 to 5 seconds, random |
| Load generator | One MacBook (M1 Pro), JMeter 5.6.3 in Podman |
120 threads came from the projection of 600,000 registered users. Using the defaults in load-calc.py (20% active per day, 30% of those in the busiest hour, 20 minute sessions), that gives about 12,000 students online at the same time, or around 30 page loads per second. Each virtual visitor reloads /play/ every few seconds, much more often than a real student, so 120 of them are enough to create that traffic.
Which endpoints we tested and why
Every virtual visitor repeats what a real browser does when a student opens https://so-gasing.id/play/. The page makes three API calls by itself every time it opens, so we included all of them. If we only tested the HTML, the server would see about a quarter of the real number of requests.
GET /play/
The HTML page itself, about 230 KB compressed. Cloudflare does not cache it, so every visit reaches our server. This is the main thing a student waits for.
GET /version.json
A small file the page checks on load to know which app version is live. Cheap for the server, but it is one more request per visit, so it adds to the total request count.
GET /api/leaderboard?scope=Nasional&metric=points&page=1&limit=50
The national top 50 ranking shown on the page. This is the heaviest call because the server has to sort students by points. It is the most likely place for the database to struggle, which is exactly what the test found.
GET /api/schools/all_kabupatens.json
The list of regions used on the page. It goes through /api, so it may touch the backend, and it is requested on every visit.
All four requests are wrapped in one transaction called "Open /play/ (full page load)", so the report also shows the total time a visitor waits.
What we left out on purpose: anything that writes data (saving progress, profile updates, checkout) or needs a login, so the test did not create junk data in production. JMeter does not run JavaScript, so the game itself was not played. Images, scripts and other static files were skipped because Cloudflare serves those from its cache and they would mostly measure Cloudflare, not our server.
Results per endpoint
| Endpoint | Requests | Failed | Median | 95th pct |
|---|---|---|---|---|
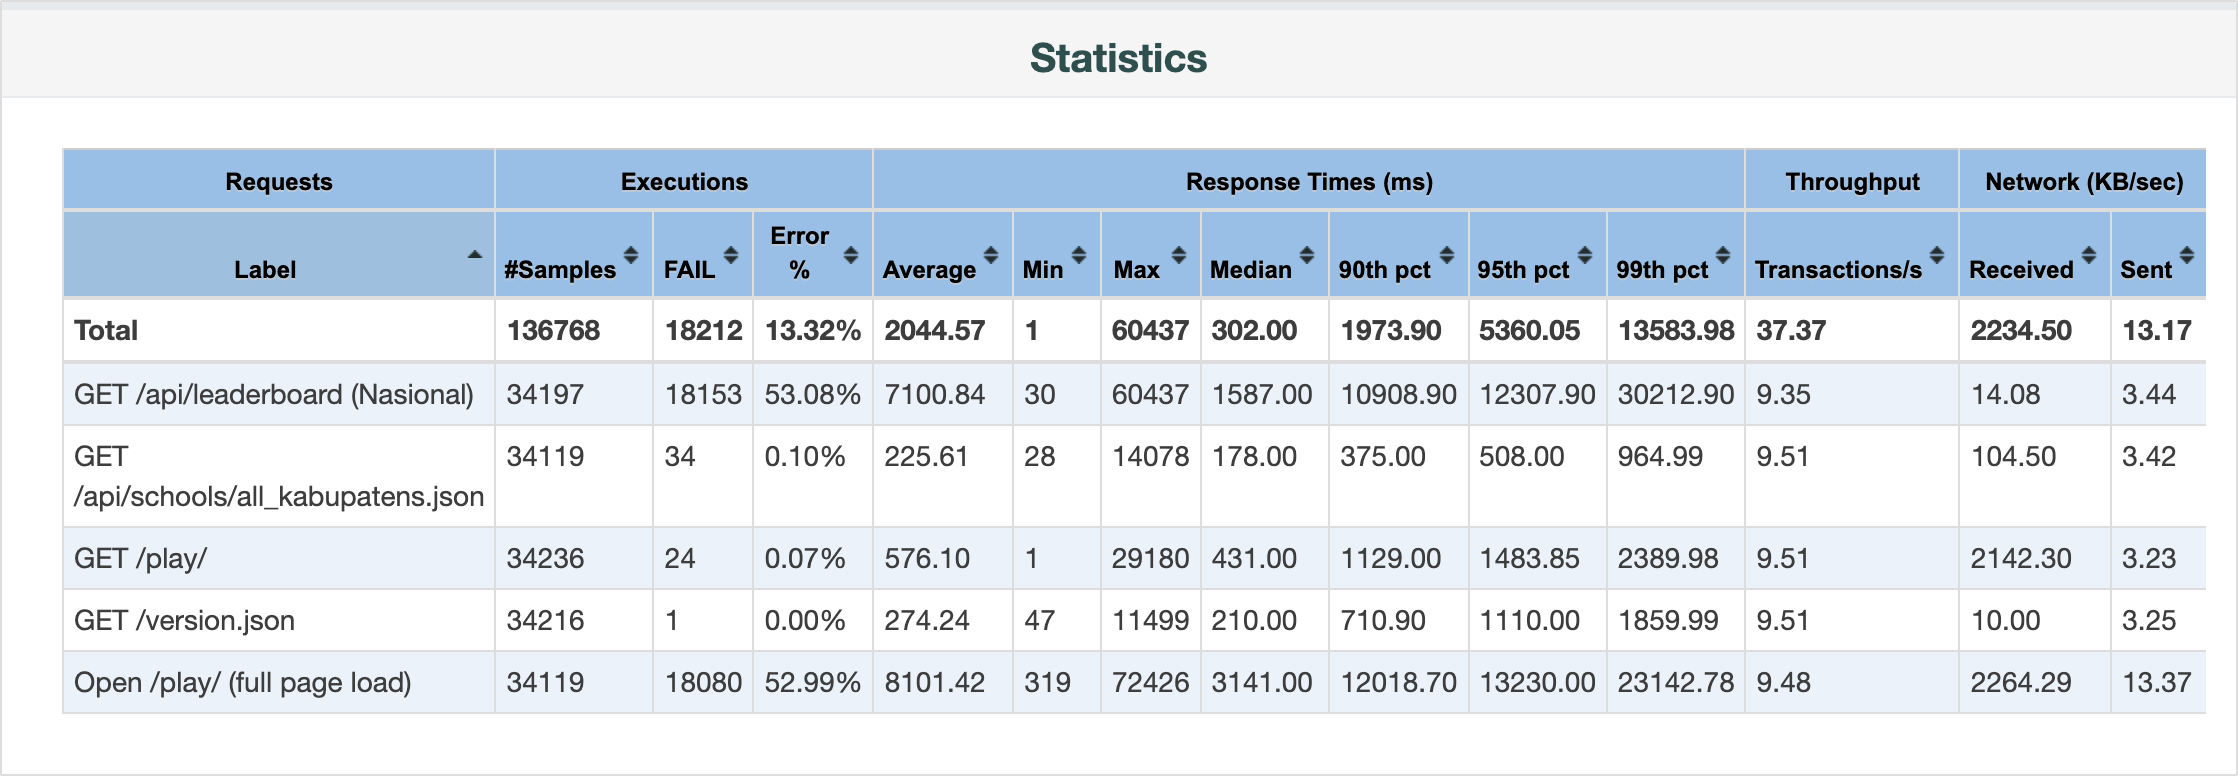
GET /play/ | 34,236 | 0.07% | 431 ms | 1.5 s |
GET /version.json | 34,216 | 0.00% | 210 ms | 1.1 s |
GET /api/schools/all_kabupatens.json | 34,119 | 0.10% | 178 ms | 0.5 s |
GET /api/leaderboard | 34,197 | 53% | 1.6 s | 12.3 s |
| Full page load (all four) | 34,119 | 53% | 3.1 s | 13.2 s |
"Median" is the typical time. "95th pct" means 95 out of 100 requests were faster than this number, so it shows what the slower visitors experience.
The test downloaded about 2.2 MB per second (around 18 Mbps). That is well within what one laptop and a normal internet connection can handle, so the errors come from the server side and not from the test machine.
What went wrong with the leaderboard
| Error | Count | What it likely means |
|---|---|---|
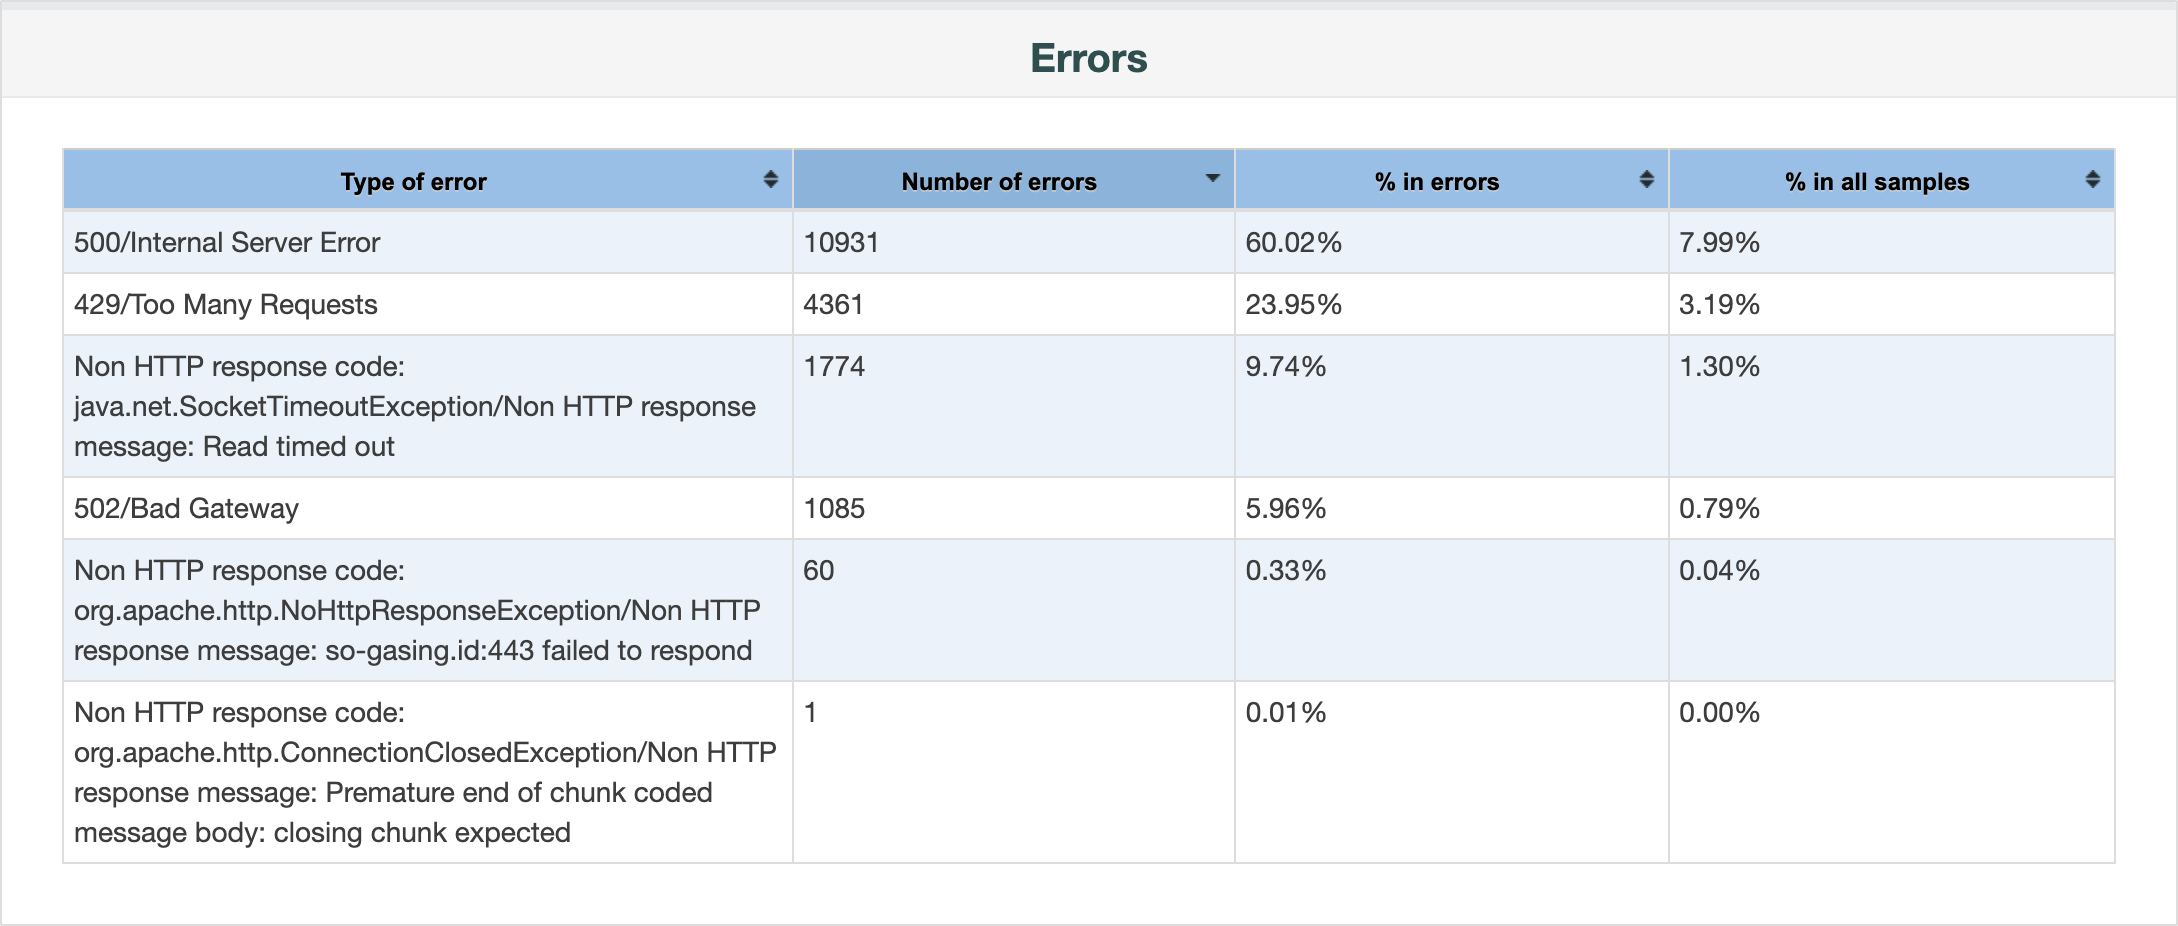
| 500 Internal Server Error | 10,931 | The app crashed or gave up. Most came back after about 10 seconds, which looks like a timeout inside the app or the database query. |
| 429 Too Many Requests | 4,361 | A rate limit kicked in. Only the leaderboard got these, so there is a limit set specifically on this endpoint. |
| Timed out after 60 seconds | 1,774 | The server never answered at all. |
| 502 Bad Gateway | 1,085 | The proxy in front of the app could not reach it, usually because the app was overloaded or restarting. |
How it played out over the hour
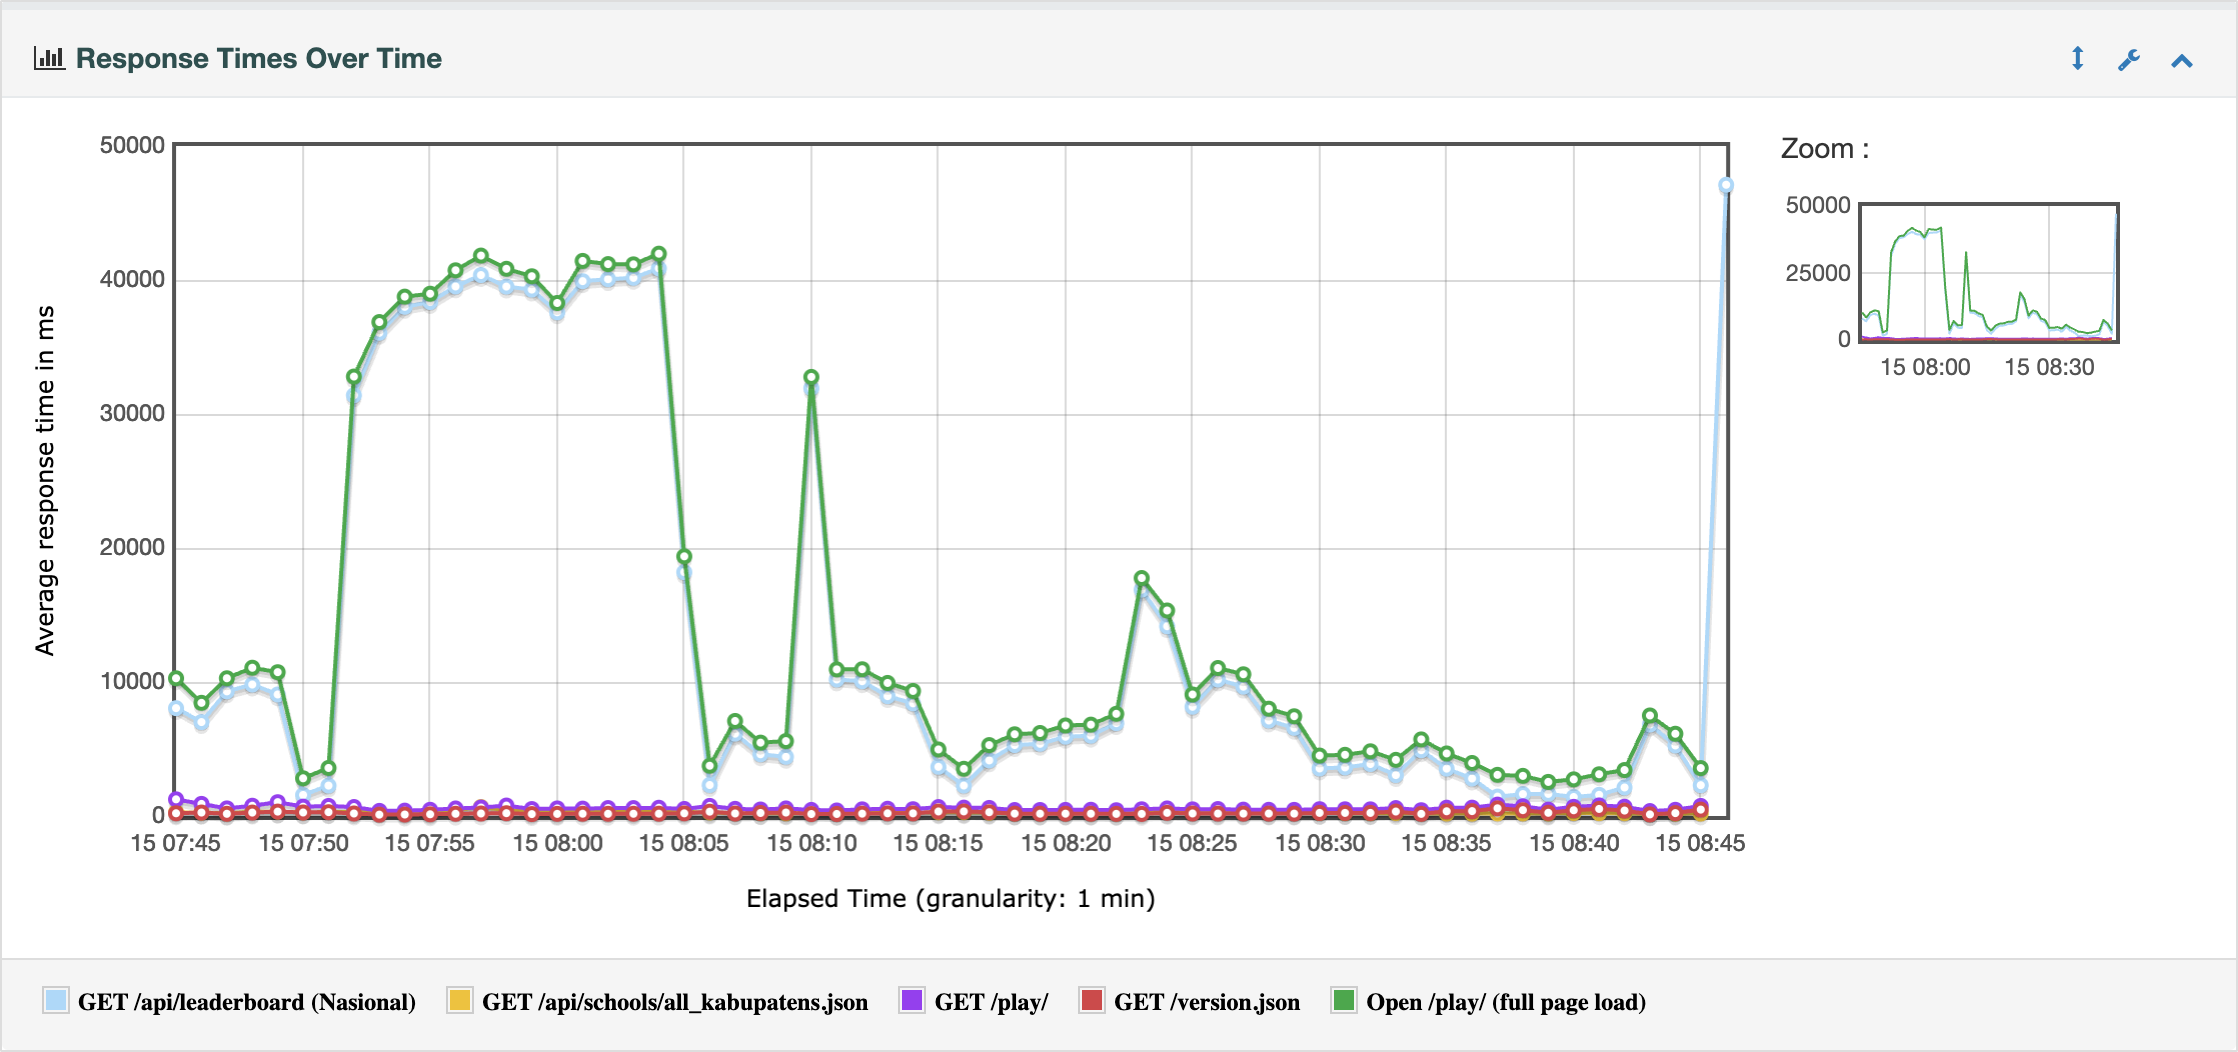
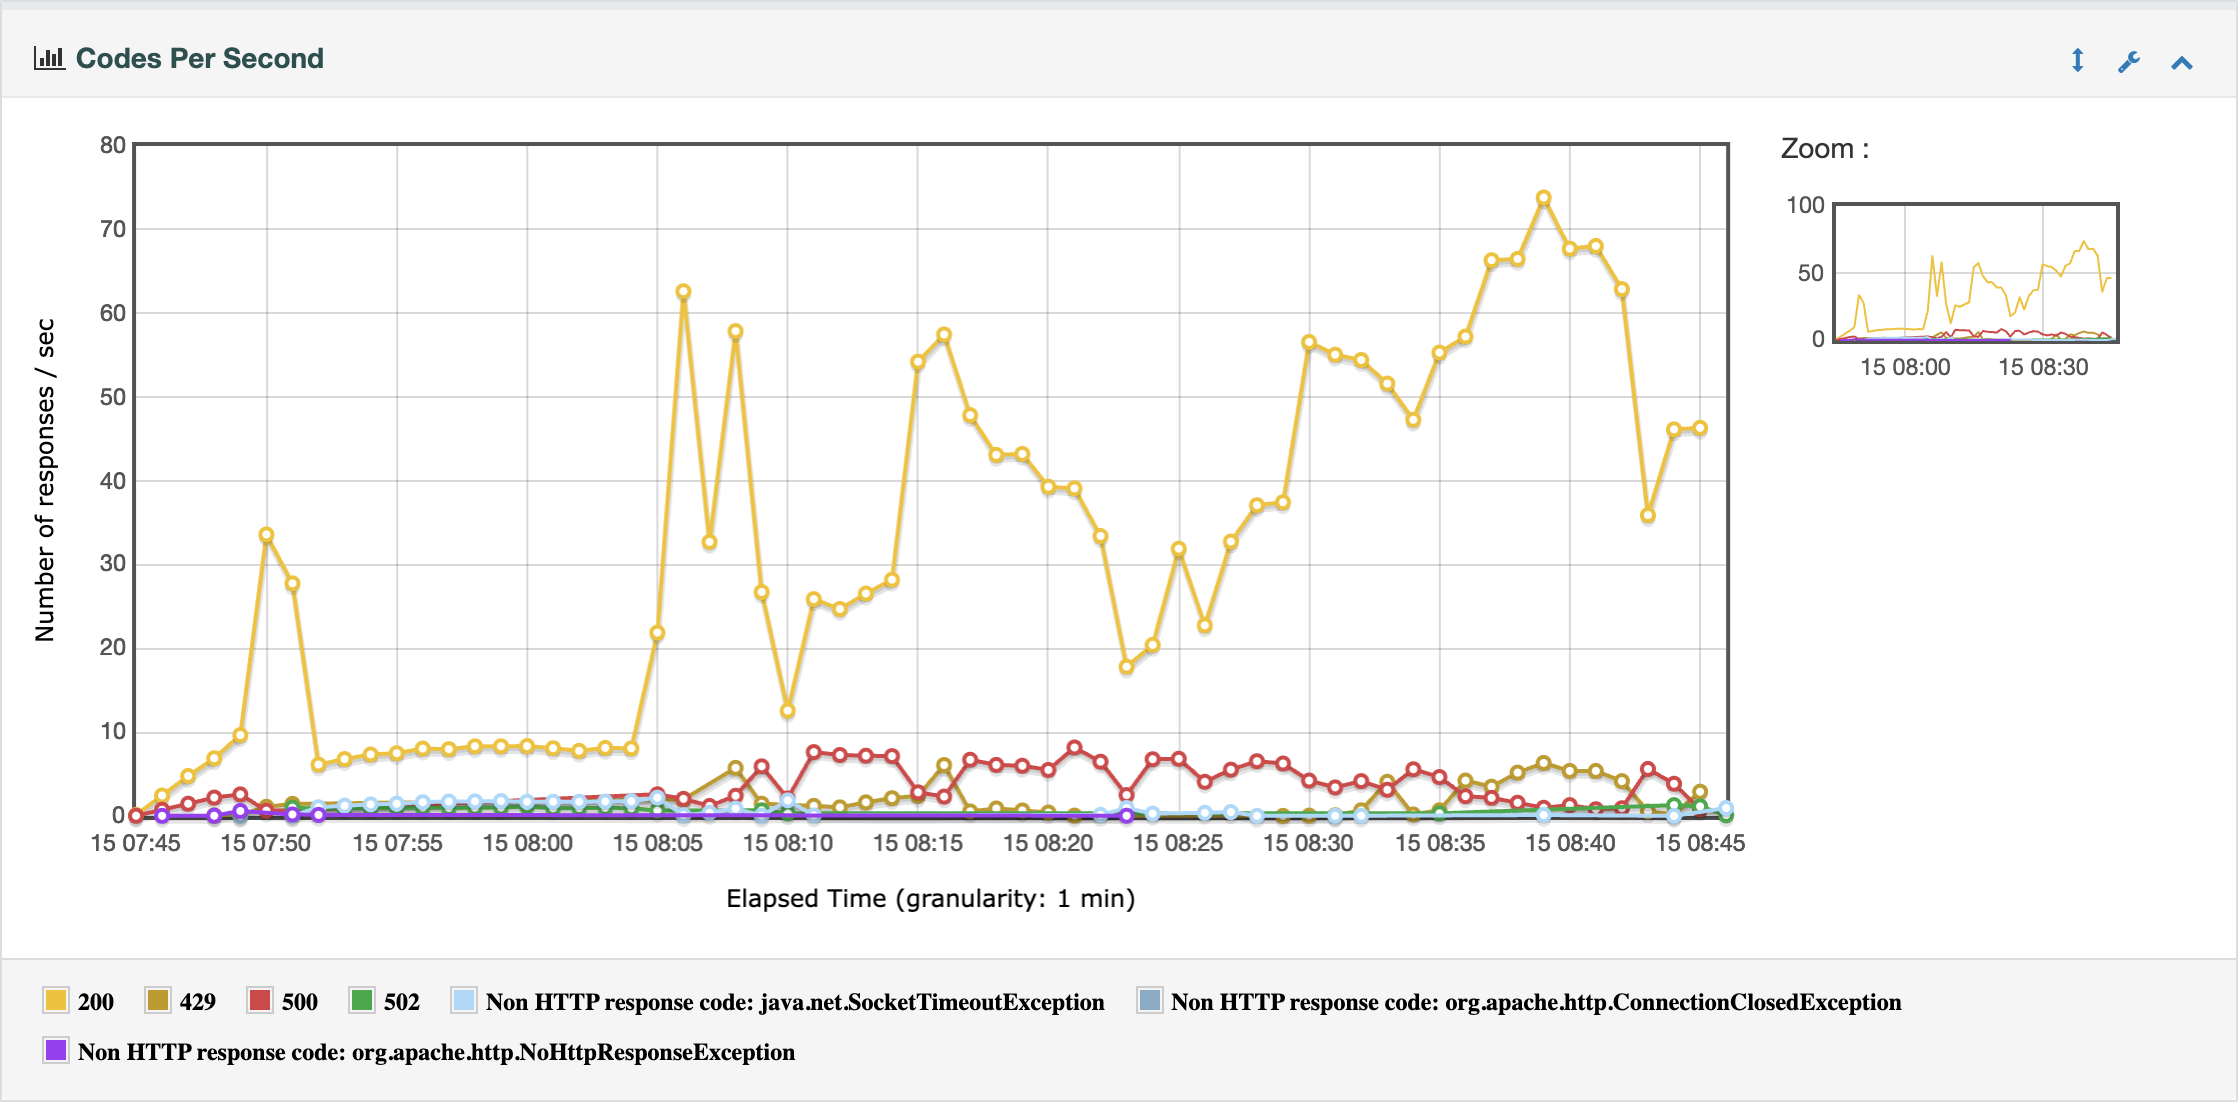
- 14:45 to 14:51 WIB, ramping up. With only a few visitors, the leaderboard already failed about 60% of the time, mostly with 500 errors after around 10 seconds.
- 14:51 to 15:04 WIB, leaderboard down. Every leaderboard request failed with a 502 or hung until the 60 second timeout. The average leaderboard time went up to about 40 seconds. Because visitors were stuck waiting, the whole test slowed to fewer than 3 page loads per second.
- 15:04 to 15:46 WIB, partly back. The leaderboard started answering again without any change on our side, but 35% to 85% of requests still failed in every 5 minute window, mostly with 500 and 429. The last 15 minutes were the best, with about 35% to 40% failures and a typical response under 1 second.
What this means
- The leaderboard is the bottleneck. Everything else on the page is ready for this level of traffic.
- The test did not reach the planned load. We aimed for about 30 page loads per second. Because every visitor had to wait for the slow leaderboard before starting the next visit, the test only averaged 9.5 per second, and about 18 per second at its best near the end. The server saw around a third of the planned traffic and still struggled, so at the full planned load it would likely be worse.
- Real students may already be affected. The leaderboard failed even with a handful of visitors, so it may also fail for real students during normal traffic, not only during this test.
- Some 429 errors may be caused by the test itself. All test traffic came from one IP address. If the rate limit is per IP, real students on many different IPs would not hit it as quickly. If the limit is global for the endpoint, real students would hit it too.
Files in this folder
| File | What it is |
|---|---|
report/index.html | Full interactive JMeter dashboard |
SUMMARY.md | This summary as Markdown |
screenshots/ | Chart and table screenshots taken from the report |
results.jtl | Raw data, one line per request |
jmeter.log | JMeter's own log |